
Open Data is a fantastic resource but we need to be careful about what it does and does not include, says Brian Moran, Deputy Chief Executive.
Last week, Inside Housing published data on housing association chief executive pay, as part of its annual salary survey.
This is one of many incredibly useful data resources that have been made available through the hard work of journalists, government workers and many others. While Inside Housing does not publish a licence for usage in their article, I consider their work (particularly as the information is already in the public domain through the published Financial Statements of housing associations) to be part of a movement that has flourished in recent years known as “Open Data” where data is openly published on the web for others to use.
With a little skill and some additional effort it is possible to combine Open Data sets together, allowing information to be used in more far-reaching ways; for people to think about areas of interest to them and make and publish new findings.
In this case for example, Jigsaw has used the Inside Housing data on chief executive pay and combined it with data openly published by our regulator, to help our board come to an informed view about the reasonableness of our own chief executive’s pay.
At a basic level, one of the things we have learned through this work is that there is a very clear and strong (logarithmic) association between chief executive pay and organisation turnover as shown in the following chart.
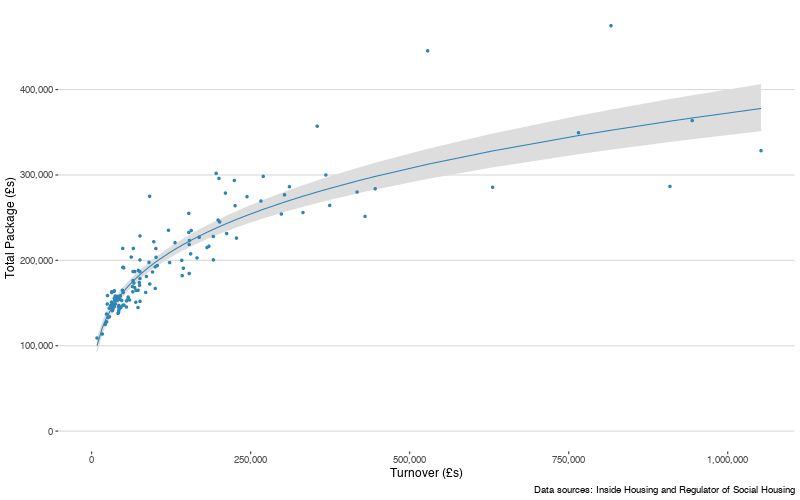
Turnover is not published in the Inside Housing data, so we get it – albeit a year out of date – from other data published by our regulator.
But we need to consider what the published data actually shows us and what it does not, where the gaps in data are and how they might limit our understanding.
So where are the gaps in the Inside Housing data on chief executive pay?
Well for a start it does not include complete details of the different working hours of chief executives. The data includes pension contributions, car allowances or bonus payments in the total but doesn’t show them separately. From the published data we also can’t understand whether there is a premium to be paid in different regional labour markets, how complex each organisation is, how experienced each chief executive is, and to what extent they are succeeding in their roles.
So while the chart clearly indicates that organisation size explains much of what is happening with chief executive pay, it does not give us a complete picture. There will be some chief executives represented in the chart’s blue dots who have very different working arrangements and differently structured remuneration packages to others.
Happily we can address some of these limitations – for example regional pay differences – by combining Inside Housing’s data with other Open Data but some important nuggets will forever remain closed-off to us.
In thinking about these gaps in chief executive pay data, I was reminded of analysis of other Open Data published by Inside Housing https://www.insidehousing.co.uk/insight/insight/housing-association-repairs-and-maintenance-spend-tracker-2022-74223 earlier this year which identifies Jigsaw in seventh place in a table entitled “Lowest repairs spend per home”.
I could imagine two types of readers: One thinking, “What are Jigsaw doing so right?”… and another thinking, “What are Jigsaw doing so wrong!?”
So I delved into the same Open Data that Inside Housing had used and could see that Jigsaw’s low repairs spend, as reported by them, was in fact not really “repairs” in the general sense of the word, but “capitalised maintenance” which is spending that specifically extends the useful life of our properties. It is our investment in the structural elements of our homes or in the replacement of key components, notably: kitchens, bathrooms and boilers.
It turns out the main reason Jigsaw appeared to be spending less on these elements than the vast majority of other HAs was not present in the data Inside Housing accessed for their article.
In reality, 58% of Jigsaw’s housing is from local authority stock transfers which were then heavily invested in between 2005 and 2010. During this rather compressed and busy five-year period, several thousand kitchens, bathrooms and boilers were replaced with new ones. And so, 12 years later, we have simply not yet needed to replace most of the kitchens and bathrooms installed in those years.
This simple fact places Jigsaw at a low point in its cycle of replacements of bathrooms and kitchens as shown in the chart below.
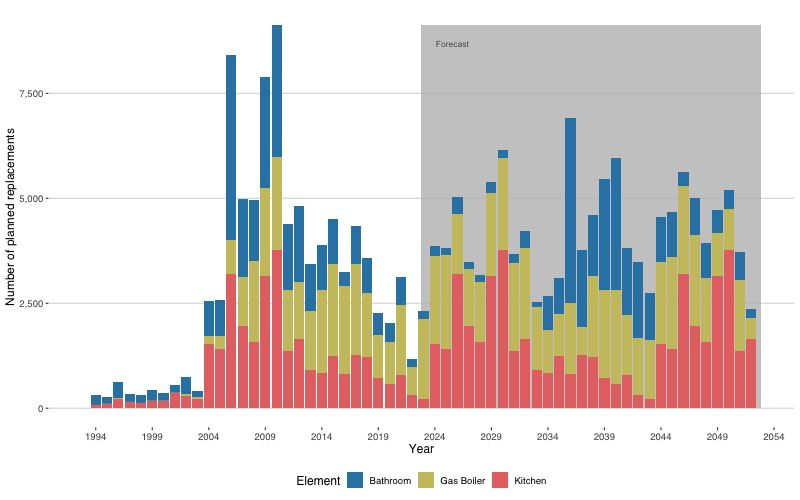
Each column in the chart represents a single year. The chart sets out the last replacement date for bathrooms, gas boilers and kitchens recorded on our database, and presents a simple forecast based on projecting these dates thirty years into the future.
The chart shows that while Jigsaw is currently at a low point in its cycle of replacements of bathrooms and kitchens, we do expect this to ratchet up in the coming years.
Our financial plans support this and show that within the next ten years, spend on capitalised maintenance will increase to levels that are much more typical in the sector.
So the secret to Jigsaw’s low “repairs” costs isn’t really a secret after-all, but it wasn’t in the published data available to Inside Housing and so the full picture could not be shown.
I fully support what Inside Housing has done in publishing both chief executive pay and maintenance spend data. Publishing this information might feel a little awkward to some, but I believe it is important for our sector to be transparent, not least in the light of the Social Housing Regulation Bill currently passing through Parliament, where housing providers will be expected to give tenants more information on their homes, facilities or services.
But to any aspiring data analysts out there, I hope I have shown the need to consider Open Data carefully. Always think about not just what the story is that the data can tell, but also what it is unable to tell.
In short, when you next embark on a journey with Open Data please do mind the gaps!